What the house knows. Occasionally.
Issue #08 | July 26, 2026
THE LEAD
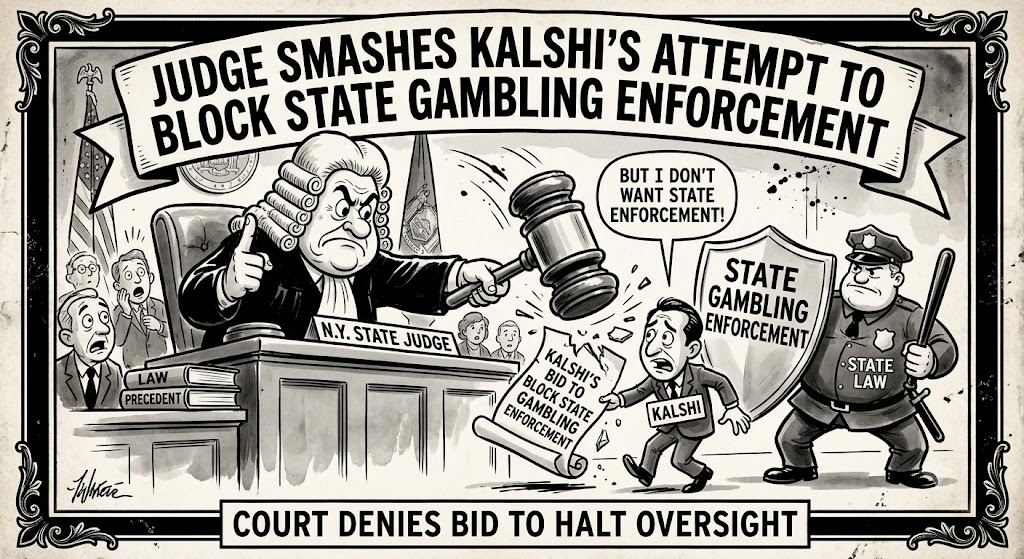
Washington got loud on prediction markets this week: the House held its first hearing on sports event contracts, Nevada’s congressmen filed a ban bill, twelve senators want the ban written into the crypto bill, and Washington state became the third state with a court order against Kalshi. Las Vegas Sands missed on the worst VIP hold in its history. Mass GGR grew 8% y/y, and ahead of market. The debate now is how much Sands is spending to get that growth. Both Nevada take-privates cleared the Gaming Commission unanimously, with Caesars guided to a spring 2027 close and MGM’s July 29 earnings the next forced word on the Diller offer.
THE BOOK
US iGaming, Sports Betting & Prediction Markets
Washington gets specific
House Agriculture oversees the CFTC, so this is the committee that writes any federal prediction market law. That is why the hearing matters.
- The House Agriculture commodity markets subcommittee held its first-ever hearing on sports event contracts July 21. Chair Dusty Johnson: Congress “should not be silent,” and more hearings are coming.
- Two former CFTC lawyers testified that the agency’s order telling Kalshi to defy Michigan’s court was “certainly a flex,” the agency’s first emergency-style intervention in 46 years.
- New bills:
- Horsford and Amodei (both Nevada) filed HR 9856, the Prediction Markets Are Gambling Act, barring sports and casino-style contracts on federally regulated exchanges and preserving state law.
- Separately, twelve Democratic senators led by Martin Heinrich asked for two amendments to the CLARITY Act, which helps set a bar on CFTC exchanges listing contracts that mimic sports bets or casino games.
- The CFTC’s sports-contract rulemaking comments close Monday July 27. The lotteries joined the opposition this week (the World Lottery Association: derivatives authorization “is not equivalent to a gambling licence”), lining up with the AGA, the tribes and the leagues.
- Lobbying spend: Kalshi spent ~$1.8M in 1H26, nearly double its full 2025.
- CME CEO Terry Duffy, who runs the world’s largest derivatives exchange, called sports prediction markets gambling on his own earnings call and said he expects the Supreme Court to settle the question.
The rest of the board
| Front | Status | Next date |
|---|---|---|
| Washington state | Preliminary injunction granted July 20: Kalshi is running “unlicensed and illegal gambling”; the third state with an operative block order | Scope proposals due Aug 3 |
| The counterpunch | Crypto.com‘s OG exchange sued Washington two days later. OG supplies parlay-style contracts to DraftKings, FanDuel, Fanatics and Underdog, so the licensed industry’s own prediction rails are now in the litigation | Case just filed |
| Nevada (state court) | Contempt hearing was July 16; still no ruling reported nine days later | Any day |
| 9th Circuit (Nevada) | Still silent; argued in April, panel seen leaning Nevada’s way | Any day |
| 4th Circuit (Maryland) | Ruling pending | Expected by ~July 30 |
| Michigan | Aug 12 geofence deadline and the CFTC’s defiance order both stand; no movement this week | Aug 12 ($500K/day after) |
| New York | 2nd Circuit appeal pending | Briefing |
The World Cup postmortem.
- Prediction markets did $20B of notional in the final 12 days, equal to the entire industry’s May. H2 Gambling Capital estimates more than 25% of legal US betting volume during the tournament ran through exchanges.
- The hangover is real but high: Kalshi’s weekly sports volume fell 55% after the final and Polymarket’s fell 70%, but Kalshi was still clearing more than $1B a day on July 23, three quarters of it sports. The next full catalyst is NFL kickoff in about seven weeks.
Online casino keeps compounding. Michigan iCasino did $301M in June, up 25%, and came within $1.9M of Pennsylvania. New Jersey iGaming ($271M, +17.5%) out-earned Atlantic City’s land-based casinos for the first time ever. Pennsylvania closed its first $7B fiscal year with iGaming ($2.93B, +18.4%) as its biggest vertical for the second year running.
Fund raise and Valuation
- Kalshi: $1B Series F closed at a $22B valuation. Next fundraise valuation is expected to be $40B.
- Polymarket: raising $400M at a $15B valuation, anchored by ICE, the owner of the NYSE. 1789 Capital, Donald Trump Jr’s fund, bought in at a $300M valuation around the time Polymarket acquired its CFTC license. That is roughly a 50x markup in about a year, held by a fund one step from the White House.
So what? It used to be whether states can stop Kalshi; it is becoming what federal legitimacy will cost. Congress, the state courts and the CFTC are all pointing at the same endgame the CME’s CEO named out loud: the Supreme Court. Watch Monday’s comment deadline, the 4th Circuit by July 30, and Michigan on Aug 12.
THE ORIENT
Macau & Asia
Sands: hold hurt results. Focus on the consumer.
- The miss: revenue $3.15B vs $3.37B expected, EPS $0.59 vs $0.77. Almost all of it came from VIP hold of 1.35% vs a ~3.3% norm. Cost: $87M of EBITDA.
- Even adjusting for luck, EBITDA of ~$517M missed by ~5% (JPM: “too large to ignore”). The bar was already low: JPM had cut its Macau estimates below consensus on July 15, before anyone reported. Bad luck plus high costs, not bad luck alone.
What the quarter said about the consumer, from the call:
- Mass GGR +8% YoY, twice the market’s +4%. May was the best mass month in company history; June was “clearly softer” on the World Cup.
- Volumes grew everywhere: table drop +15%, slots +30%, VIP volume +73%. Sands is now #1 in rolling volume with 26% share, from #4 a year ago.
- Premium mass +13% YoY but -11% QoQ: the top end took the World Cup hit while base mass held.
- Watch that split when Galaxy and Wynn report.
- Renovated product earns more: Londoner and Four Seasons run above 2019 levels adjusted for hold. No 2Q guide provided.
The cost question:
- Daily opex +18% YoY. Mass reinvestment 26.6% of revenue, +340bps YoY. Morgan Stanley: “don’t see Sands gaining EBITDA share consistently despite intense reinvestment.”
- Management says opex growth slows in 2H and kept the $700M-a-quarter Macau EBITDA target (“we have some work to do”).
Singapore: same test, opposite sign.
- Hold HELPED this quarter (+$37M). EBITDA luck-adjusted decline was ~5% y/y vs. reported -10% y/y.
- The consumer is fine: mass GGR +5% YoY through the World Cup.
- The risk is concentration: rolling volume halved in one quarter ($18B to $9.3B) because a few very large players stepped back. Margins stay best in the industry (49.9%). IR2 on track for early 2031.
Korea: the policy risk now has numbers.
- Shinhan quantified the proposed levy hike (10% to 15% of revenue): 2026 profit falls 37% at GKL, 29% at Paradise, 21% at Lotte Tour.
- The casino trade group warns of bankruptcies: half of Korea’s 18 operators have lost money ten years running. It is also fighting the plan to replace permanent licences with five-year renewals.
- A separate AML proposal would end anonymous play. Kangwon Land’s own survey implies a ~20% revenue hit.
- Bill expected in 2H26.
Brief items
- Star’s June quarter: group EBITDA loss narrowed to AU$8M; Sydney still impaired by carded play and cash limits.
- SkyCity agreed to sell its Auckland Grand Hotel (~NZ$200M); asset sales now beat target, gearing heads under 2x, FY27 dividend possible.
- Delta Corp took its Daman slots case to India’s Supreme Court.
- PAGCOR’s casino-privatization recommendation reaches the Philippine president in August; the central bank tightened junket AML scrutiny for banks.
So what? The Sands print sets the frame for 3Q: the consumer recovered from the World Cup, and the concern is reinvestment spend.
THE OLD WORLD
Europe + Canada
Two things
- The UK changed governments, and the new prime minister has gambling history. Andy Burnham, who once said he wanted to “relegate gambling sponsorship of sport to the history books,” is set to become PM and is naming a cabinet. Horse racing committee fears a sponsorship and levy crackdown, and affordability checks and high-street gaming rates are already back in the debate. Every UK-exposed name (Entain, Flutter’s UK book, Rank, evoke) now carries new-government risk into the autumn budget. This is the first UK item in two issues because a change of government is worth pricing.
- Europe keeps closing on prediction markets, which supports the licensed complex. France escalated to a full block on Polymarket (578K French visits in June; Polymarket will sue).
Two tax watches, one line each. Italy’s budget assumes +€807M of 2026 gambling receipts while actual collections run -7.8% through April; that gap usually closes with rate hikes (Lottomatica, Flutter’s Sisal/Snai, Entain’s Eurobet). Colombia filed a third attempt at a permanent 19% VAT on deposits, aimed at Betsson’s largest region.
So what? A new UK prime minister has gambling in his sights, right on top of this year’s tax hike. And France is tightening prediction market rules the same way the US is.
THE LOCAL
U.S Local Gaming & Deal Watch
Nevada cleared both deals in one sitting.
- The Gaming Commission unanimously approved the last two Fertitta directors and Caesars’ financing shelf on July 23. The deal now runs the regulatory calendar (~25 jurisdictions) toward a spring 2027 close. Caesars reports Q2 on Tuesday.
The regionals are fine; the tourists are not.
- Boyd: revenue flat at $1.03B, locals margins above 50% excluding construction disruption. Management: customers are “staying closer to home” while destination properties stay soft. $170M returned in the quarter.
- Monarch: net income +20% on +4% revenue, zero debt, shopping for M&A. Jefferies Hold at $123 on cost pressure; Truist Buy at $144.
- Truist on the group: regionals running about +4% GGR into the prints, “the best house in an unloved neighborhood.”
June state scoreboard
| State | June GGR | YoY |
|---|---|---|
| Massachusetts | $94.2M | -3.6% |
| Delaware | $37.5M | -21.0% |
| Kansas | $34.1M | -0.4% |
| Nebraska | $24.9M | +20.1% (Harrah’s Columbus ramp) |
| Florida (non-tribal slots) | $53.8M | -3.4% |
| Deadwood, SD | $15.2M | +13.6% |
So what? Every regional datapoint this week repeats the same sentence: drive-to demand is stable, fly-to leisure is the weak spot. That is the setup for Caesars on Tuesday and MGM on Wednesday, where Strip softness is already known and the questions are cost control and, for MGM, whether the board finally says something real about People Inc.’s offer at $48.30.
THE PROJECTS
Global Greenfield & Development Watch
- Resorts World New York (Genting). Phase 2 broke ground inside the $5.5B program: a 7,000-seat arena, 1,600 hotel rooms, and 1,400 slots added to the floor now. Management says it is running ahead of schedule. The first-mover gap over Bally’s Bronx and Hard Rock’s Metropolitan Park, which must build from scratch, keeps widening.
- Wynn Palace “Enclave” approved. Macau signed off on the 432-suite tower: +25% room count, +50% suite supply, at $900-950M with a 60-month window. CreditSights sizes the bill: group capex jumps from $400-450M this year to $700-750M in 2027, with leverage still above pre-pandemic.
- Bally’s Chicago topped out; spring 2027 opening reaffirmed ($1.7B, 3,400 slots). The Las Vegas financing plan is due to the LVCVA in early August; that is the harder test.
- Japan round two. Hokkaido starts polling operators and municipalities this quarter for the May-November 2027 application window; only Tomakomai remains an interested host. The second IR race has quietly begun.
So what? The capex cycle is broadening while the sector trades on buybacks: Wynn just added ~$950M of spend, Genting is pouring $5.5B into Queens, and Bally’s has two weeks to show the LVCVA real money.
OTHER
Sweepstakes & Skill Games
A quiet week in the gray market. Pennsylvania’s seizure clock keeps running toward mid-October with no special session scheduled, and Indiana’s promised enforcement wave has still not surfaced four weeks after its ban took effect.
THE SHIFT
Moves & Shakers
- Michigan Gaming Control Board: a new chair takes over in August, a personnel change at the regulator of a top-3 iGaming state mid-fight with Kalshi.
- NCLGS: Georgia Rep. Al Williams elected president; priority one is unregulated prediction markets and sweepstakes.
THE CALENDAR
| Date | Event |
|---|---|
| July 27 | CFTC sports-contract rulemaking comments close |
| July 28 | Caesars Q2; BetMGM Q2 update |
| July 29 | MGM Q2 (forced disclosure point on Diller); FDJ H1; Churchill Downs Q2 |
| ~July 30 | 4th Circuit ruling expected, Kalshi v. Maryland |
| July 31 / Aug 3 | Flutter’s last LSE trading day / delisting |
| ~Aug 1 | Macau July GGR (the MOP21B test); Minnesota PM ban effective |
| Early Aug | Nevada June + FY26 revenue report; LVCVA June visitation; Bally’s LVCVA financing plan; NGC August meeting (Venetian $7.2M vote) |
| Aug 3 | Washington state injunction scope proposals due |
| Aug 7 | Iowa preliminary injunction hearing |
| Aug 12 | Kalshi’s Michigan geofence deadline ($500K/day after); Sands China dividend payable |
| Aug 13 | Entain interims |
| Any day | Nevada contempt ruling; 9th Circuit, Kalshi v. Nevada |